One aspect of lesson study that I really appreciate is how the learning lingers well beyond the end of the study. During this cycle our team learned a lot about using representations to support students’ understanding of multiplicative comparison word problems. I knew though, that as I milled our work over in my mind, there would be more learning; nuggets that were currently hidden, but would be unearthed as I continued to reflect on the work.
We implemented our lesson on multiplicative comparison (MAFS.4.OA.1.2 or CC.4.OA.2). If you’re curious about the general structure of the lesson and the research we consulted while writing it you can check out my first post here.
The First Implementation
In the first class that we implemented the lesson, students noticed a lot of things about the bar model (see figure 1) in the warm-up, but didn’t compare the lengths right away. They noticed the colors, the pattern, and how there were six sections total. We were deliberate about introducing a representation that we thought would be useful to students (NCTM, 2011), but there was some guidance needed to get to where students were using the visual models to compare quantities. Also, we didn’t see a lot of students adopt the visual model to support their sense making and explanations during the main task of the lesson.
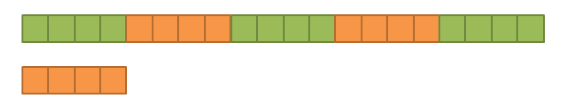
figure 1
Debrief and Revision
Our debrief and revision time was quick due to a substitute not showing up. During the debrief we all shared what we had collected in regards to students using the visual model and dialogue that would illustrate student understanding. We all agreed that there had been little transfer in regards to students using the visual models. We decided to make the warm-up task a little more explicit in the line of questioning around the visual model and what we wanted them to notice. Rather than ask them, “What do you notice? What do you wonder?,” we asked students, “What do you notice about the top row and bottom row?” We were hoping that this would better focus students’ attention on the different lengths.
The Second Implementation and Debrief
During the second implemenation we went forward with this more explicit warm-up. Students moved to comparing quantities with the bar model, but still didn’t take the bar model and run with it during the main task. We used a planning period to debrief the second implementation of the lesson and determined that the bar model was a good model, but students just needed more time with it. This was challenging for our team because we knew that this was a single lesson, but really wanted to see evidence that students were moving forward in their thinking. We acknowledged that students needed more time representing these types of problems and decided to spend the rest of the week and the next on the same standard during the intervention block. This gave us about 75 extra minutes of instructional time to utilize what we had learned.
The Follow-Up
Following the lesson study there was some conversation between my interventionist and I about how to best move students forward with the additional instructional time we had. We decided to encourage students to use snap cubes or base ten blocks to model and make sense of the multiplicative comparison situations. We thought that going back to a concrete representation could support student understanding of these problems. In following up with this work during the intervention block one of the tasks we used was:
Jake had 18 toy cars. This was three times as much as his little brother. How many toy cars did his little brother have.
We encouraged students to model the problem with manipulatives or drawings, temporarily abandoning the focus on equations to emphasize sense making. There was something about being able to physically iterate the bar of 6 along the bar of 18 that really supported students seeing the relationship between the two amounts. When I asked students “Is that one (the bar of 18) three times bigger than that one (the bar of 6)?” students moved the smaller bar along the bigger bar to prove that it was. Also, we saw students’ comfort level with explanation of the relationship skyrocket. After seeing the response of students to using manipulatives, one of our team members exclaimed, “We totally should have written that into our research lesson.” Our team hadn’t considered that 4th grade students would need this type of experience with manipulatives. It makes sense though, as this is their first experience using multiplication to compare. Also, we saw students naturally begin moving toward drawings rather than continue using the blocks. The move to encourage students to go back to the concrete wasn’t a new idea, but it was exciting to see students respond so positively to a strategy.
Last week we reassessed this standard with an assessment that included all three types of multiplicative comparison problems (result unknown, measurement division, and partitive division) and saw a mixed bag in regards to the raw scores. While many students showed significant improvement in their raw scores, others did not. Often, the students’ raw scores didn’t reflect the learning that had taken place. A spattering of what we saw is illustrated below with some samples of student work. Over the two weeks we saw an increase in students using visual models to help them make sense of problems (see figure 2).
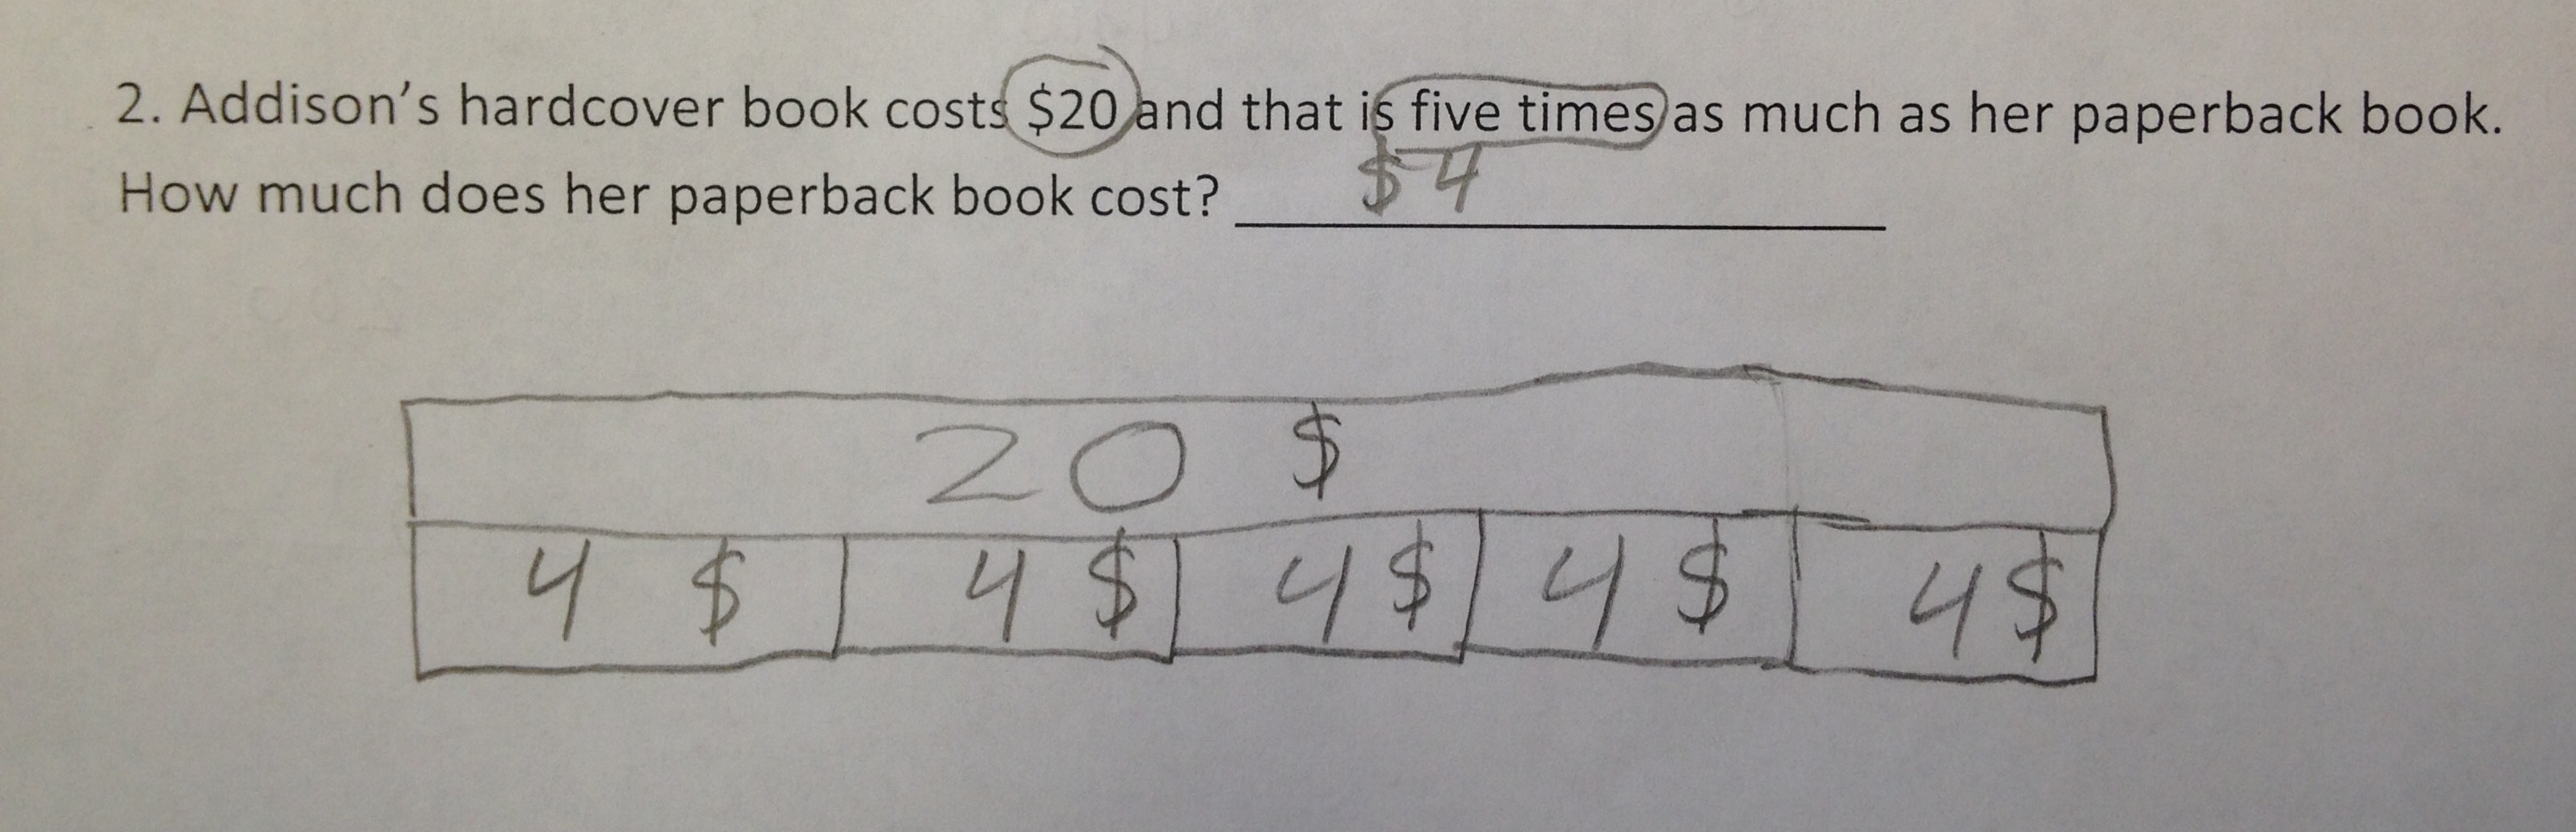
figure 2
There were instances where students were able to accurately represent the problem, but made a computational error (see figure 3). Here it looks like the student miscounted and forgot to count one of the 7’s.
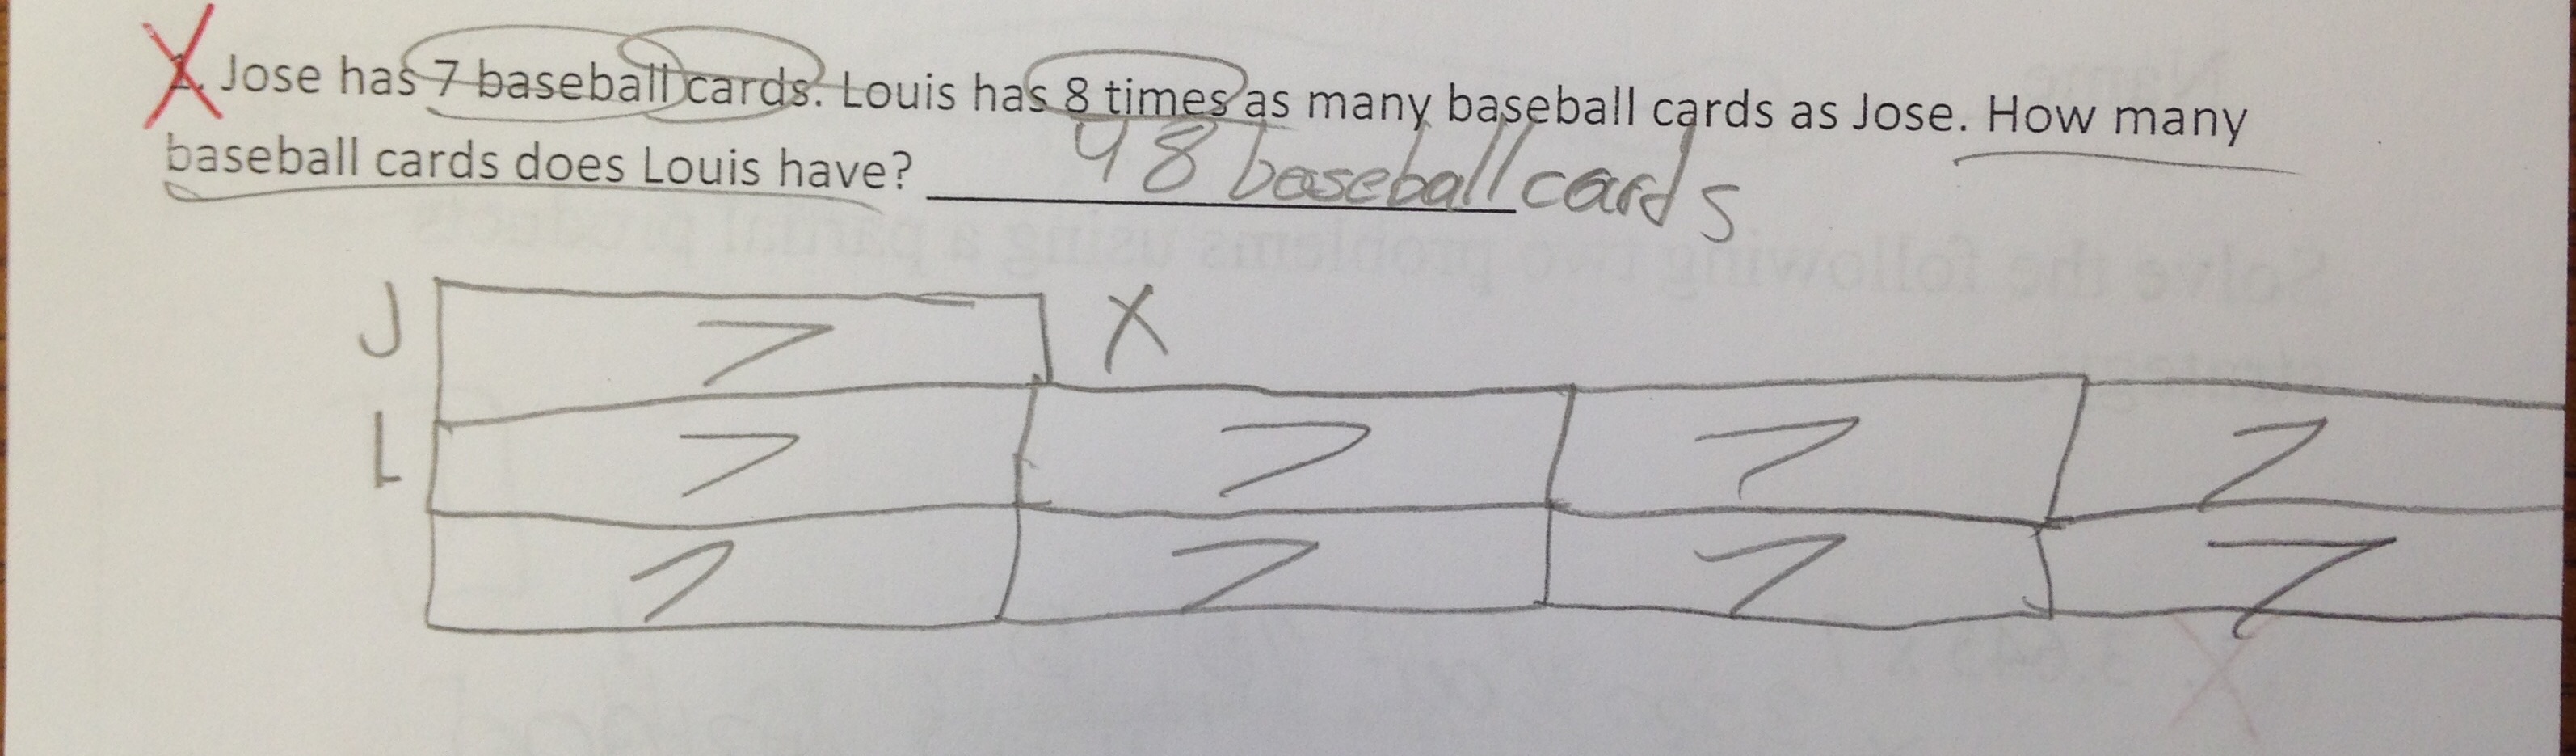
figure 3
In other instances, the student used an accurate representation, but wasn’t able to “find” the solution in their model. (see figure 4)

figure 4
I think both pieces of student work that were incorrect illustrate how a student can bring a lot of understanding to a situation, even on a missed item. I can see these students arriving at a correct solution with a little discussion and feedback. Also, I like these last two samples because it shows how students began utilizing labels to communicate what the different parts of their drawings represented.
There’s clear evidence that our work has had an impact on student learning. Also, it’s provided a valuable professional learning opportunity for all who participated in the lesson study, including myself. Lewis & Hurd (2011) state that “The real ‘product’ of the lesson study cycle is not the lesson. Lesson study builds educators’ knowledge, motivation, habits of learning, and professional learning community.” (p. 16) We were able to experience this, and it’s the opportunity for this type of learning that keeps me coming back to lesson study.
References
Leinwand et al. (2014). Principles to actions: Ensuring mathematical success for all. Reston, VA: National Council of Teachers of Mathematics.
Lewis, C & Hurd J. (2011). Lesson study step by step: How teacher learning communities improve instruction. Portsmouth, NH: Heinemann.
Now we know how to tackle this standard the first go around next year!